QFD Tool

House of Quality online

Quality Function Deployment software, from the House of Quality to the shop floor

Turn what customers say into engineering numbers you can act on. Build a House of Quality, link it to the next stages, and see which parameters matter most — and why.

Free plan with every analysis included. No credit card.

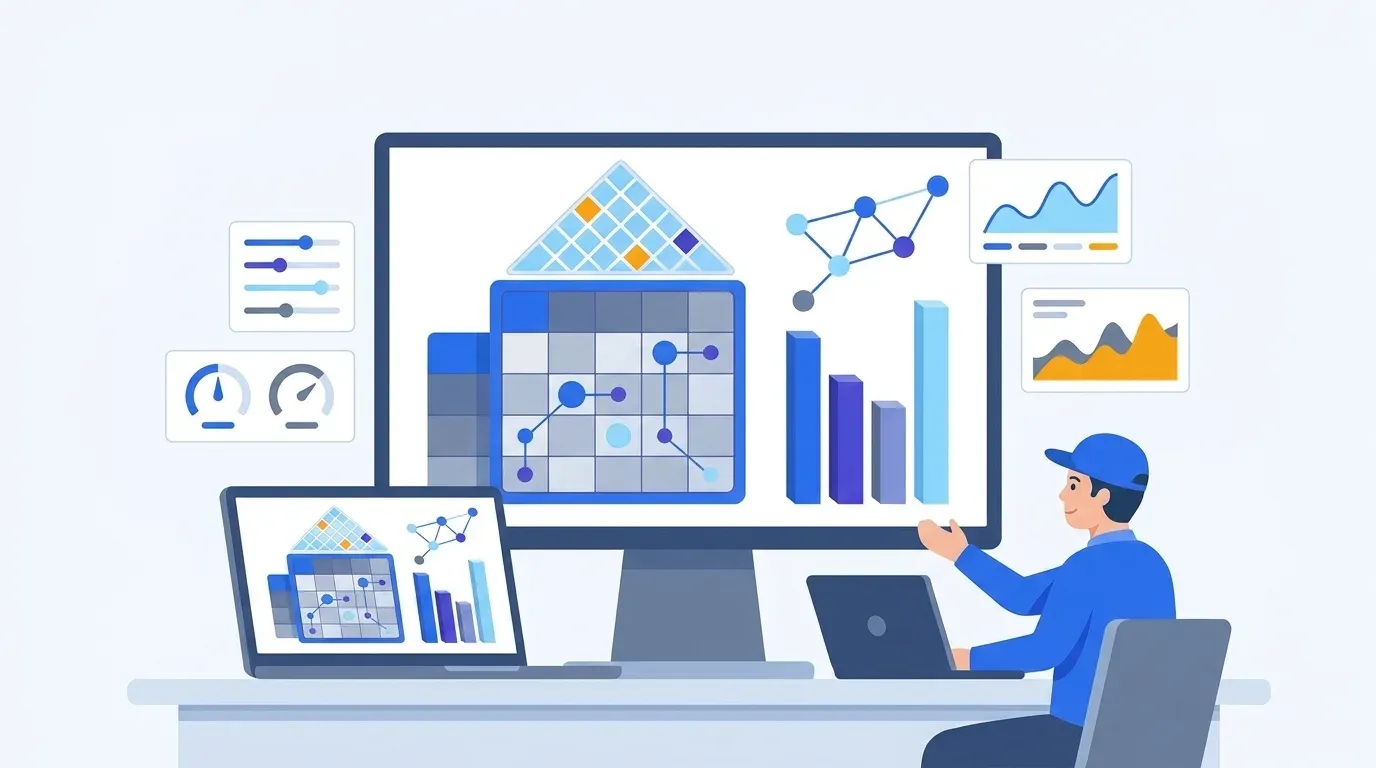
A House of Quality: customer needs on the left, a relationship matrix with a correlation roof, an engineer with a tablet and priority bars on the right

What is Quality Function Deployment (QFD)?

QFD is a way to translate customer needs (the whats) into engineering characteristics (the hows) and decide which of them deserve your effort. Customers say “the kettle boils fast” and “the handle never gets hot”. Engineers need heating element power in watts and handle temperature in °C.

The House of Quality is the matrix that connects the two. Each cell says how strongly a characteristic affects a need — 1, 3 or 9. Multiply by importance, add it up, and you get a ranked list of what to work on. The triangular roof shows where characteristics help or hurt each other.

The method was developed by Yoji Akao and first used at Mitsubishi Heavy Industries’ Kobe shipyard in 1972. Toyota and its suppliers adopted it, and from there it spread through the automotive industry and beyond.

QFD Tool is built for product engineers, systems and quality engineers, R&D managers — and for students who need to hand in a proper House of Quality by Friday.


Why spreadsheets break

One House of Quality fits in Excel. A cascade of four, kept consistent through every change, does not.

In a spreadsheetYou copy the top characteristics onto the next sheet by hand — and do it all over again every time a weight changes.
In QFD ToolCharacteristics above the threshold become the next stage’s requirements automatically, weights included.
In a spreadsheetSomeone deletes a row, a formula quietly points at the wrong cell, and the priorities are off. Nobody notices.
In QFD ToolEvery priority is recalculated by the same model on every change. There are no formulas to break.
In a spreadsheetThe roof is just a drawing. Correlations sit there and change nothing.
In QFD ToolThe roof is part of the math: correlations adjust priorities, and negative ones show up as technical conflicts.
In a spreadsheet“Why does this tolerance matter?” — the person who knew left the project last year.
In QFD ToolThe traceability graph shows which customer needs a parameter serves, and how much each one contributes.
In a spreadsheetTurning the matrix into something presentable eats an evening.
In QFD ToolOne click exports the whole document to PDF, or any single stage to SVG.

What you get

Everything a House of Quality needs, plus the analysis that is painful to do by hand.

A cascade of Houses of Quality

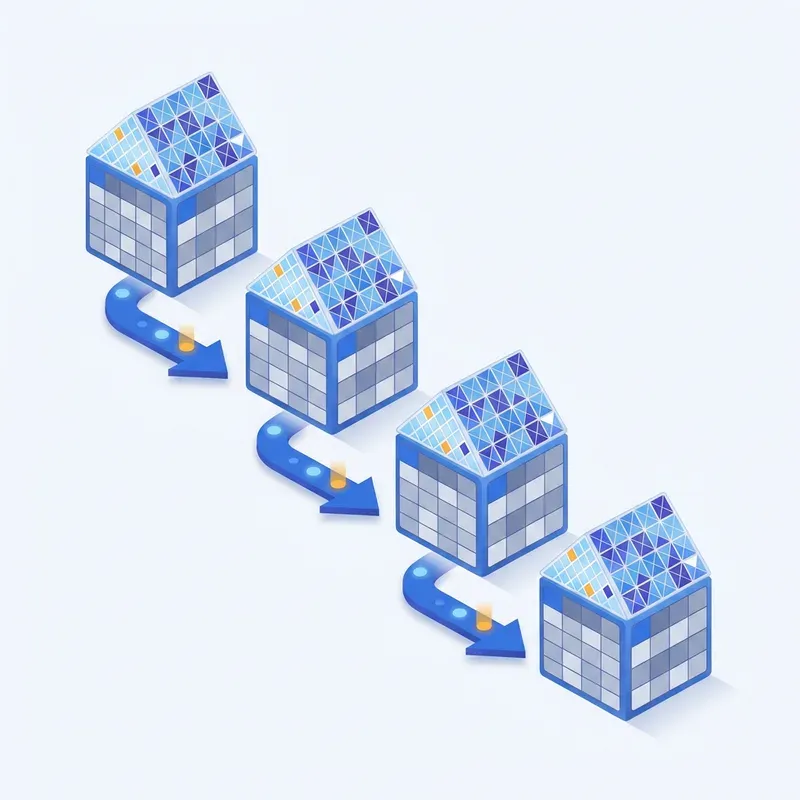
Chain as many stages as your project needs — the classic four go from customer needs to product characteristics, parts, process and production. Change something on stage one and every stage after it recalculates.

A matrix and roof that actually count

Rate each requirement from 1 to 10, mark relationships as 1, 3 or 9 with a click, set an improvement direction and target value for every characteristic. Correlations in the roof feed straight into the priorities.

Benchmark against competitors

Score your product and your rivals from 1 to 5 on each customer requirement, and compare measured values characteristic by characteristic. Where you lag behind, the weight goes up.

Priorities grounded in reality

Factor in implementation difficulty and your engineers’ own assessment. A characteristic that is cheap to improve and badly behind the best competitor rises to the top.

Dominance analysis

See which customer requirements really drive the final result. If one need accounts for more than half of the outcome, it is flagged as high risk — worth a second look before you commit.

Technical conflicts

Pairs of important characteristics that pull against each other — more power vs. less noise, lighter vs. stiffer — are found automatically and ranked by severity.

Traceability graph

Follow any final parameter back to the customer needs behind it, with the contribution of each one in percent. Handy for design reviews and for defending a decision.

In the browser, saved as you go

Nothing to install. Documents live in the cloud and save automatically. Export to PDF or SVG, and on Pro start from a ready-made example instead of a blank page.

How it works

Customers voicing their wishes in speech bubbles that flow into a list of requirements
Step 1

Capture the voice of the customer

List what customers ask for in their own words, rate how much each need matters, and score how you and your competitors perform today.

Four Houses of Quality linked by arrows into a cascade
Step 2

Build the cascade

Add engineering characteristics and fill in the matrix with a click per cell. Add a stage, and the most important characteristics arrive there as requirements on their own.

Priority bars under a magnifying glass, with a warning sign marking a conflict
Step 3

Analyze and decide

The summary report shows the driving requirements, the characteristics that matter most at the end of the chain, and the sharpest conflicts. Export it and take it to the meeting.

Step-by-step guide in the docs →

Where the House of Quality is used

Anywhere you have to turn “what people want” into “what we build”. A few typical translations from a customer need to an engineering characteristic:

A product team at a task board next to a laptop and phone showing an app, with user feedback bubbles

Software and IT

“The app feels fast” becomes time to first screen in milliseconds; “sign-up is painless” becomes the number of steps in onboarding. QFD helps decide which non-functional requirements deserve the next sprint.

An engineer next to a car, with callouts linking wheels, engine and speedometer to its parts

Automotive

The industry where QFD took off after Toyota adopted it. The textbook example: “the door is easy to close” turns into the energy needed to close it — which immediately collides with “no road noise” and a tighter door seal.

A smartphone, smartwatch, headphones, circuit boards and a battery on a designer’s desk

Electronics

“The battery lasts all day” maps to capacity in mAh and standby current; “it doesn’t get hot” maps to case temperature under load. The roof shows right away that the two compete.

A patient monitor and an infusion pump with a doctor and an engineer reviewing a checklist

Medical devices

“Easy to use with gloves on” becomes button size in mm and actuation force in N. When every design input has to trace back to a user need, a traceability graph saves a lot of explaining.

A robotic arm and conveyor with machined parts, a caliper and an engineer with a tablet

Manufacturing and machinery

“The line rarely stops” becomes mean time between failures; “quick changeover” becomes minutes per changeover. Later stages carry it down to tolerances and process settings.

A kettle, a coffee machine and a vacuum cleaner

Consumer goods

“The kettle boils fast” means heating element power in watts; “the vacuum is quiet” means noise in dB(A). The classic place to learn QFD — everyone has an opinion about a kettle.

A guest at a hotel reception desk, with a dotted customer journey leading to a service counter

Services

At a hotel, “check-in is quick” becomes average check-in time; at a bank, “no surprise fees” becomes the number of charges a customer has to understand. The characteristics here are service standards rather than parts.

Students with laptops around a table while one points at a House of Quality matrix on the screen

Education

QFD is a staple of quality management and product design courses. The free plan often covers a coursework assignment, and the same method works for designing a course: “practical skills” becomes the share of lab hours.

Learn more about QFD

Free to start, Pro when the project gets serious

No subscription and no auto-renewal: pay once for the time you need, and nothing is charged afterwards.

Compare plans →
Free
$0

2 documents, up to 2 stages, 10 requirements and 10 characteristics per stage. Every analysis, export with a watermark.

Pro
$29 / 30 days

or $249 for 12 months. No limits, clean exports, documents based on examples.

Build your first House of Quality today

Look through the examples, then put your own product into the matrix and watch the priorities move. It takes a few minutes and costs nothing.

Start your free QFDBrowse examples